ZapApps updates provide information on the features, bug fixes, and improvements in each release. This article includes updates released from the past week for the ZapERP inventory software.
Check out the previous updates:
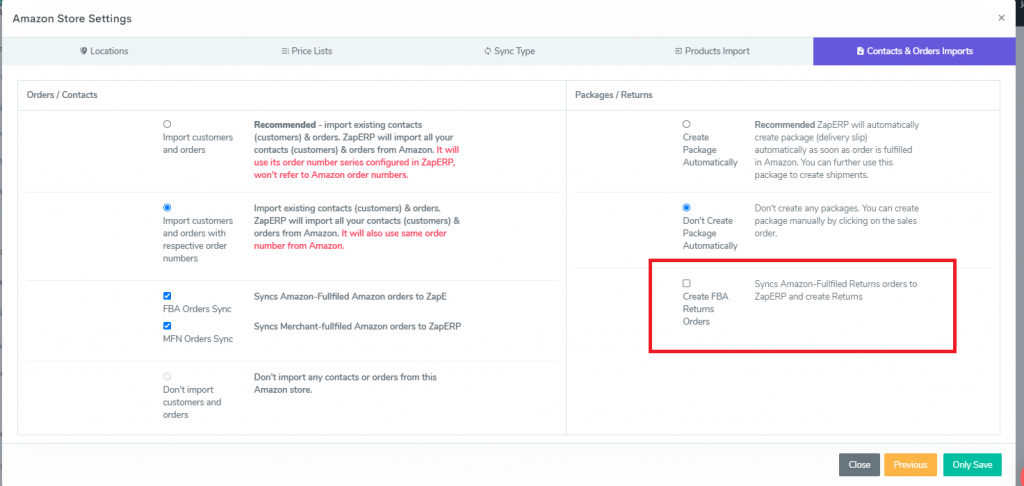
1. Amazon Return
Now ZapERP pulls returns from Amazon FBA and MFN. The Returns will be automatically pulled every 24 hrs, and the quantity of the returned item will increase. Go to ZapERP Amazon Settings >> Order tab and enable the checkbox to pull returns.
You can see all the returns will be visible in the ZapERP Returns section.
2. eBay 2-way sync
Products updated quantities and prices will now be pushed to eBay. You need to create products on eBay, and if you need to change the SKU of the products first, you need to change them in ZapERP and then on eBay.
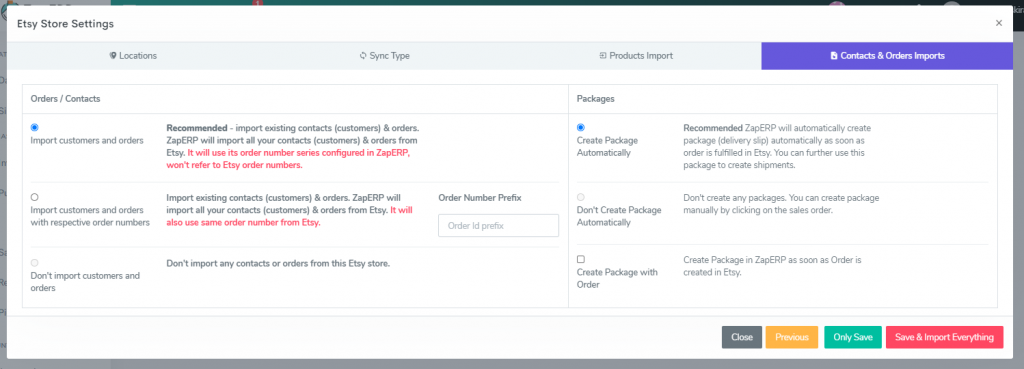
3. Etsy improvements and added setting model
The setting module is added to ZapERP Etsy Integration. Now you can pull order numbers, Import products with their buy prices, and create packages automatically if the order is fulfilled in Etsy.
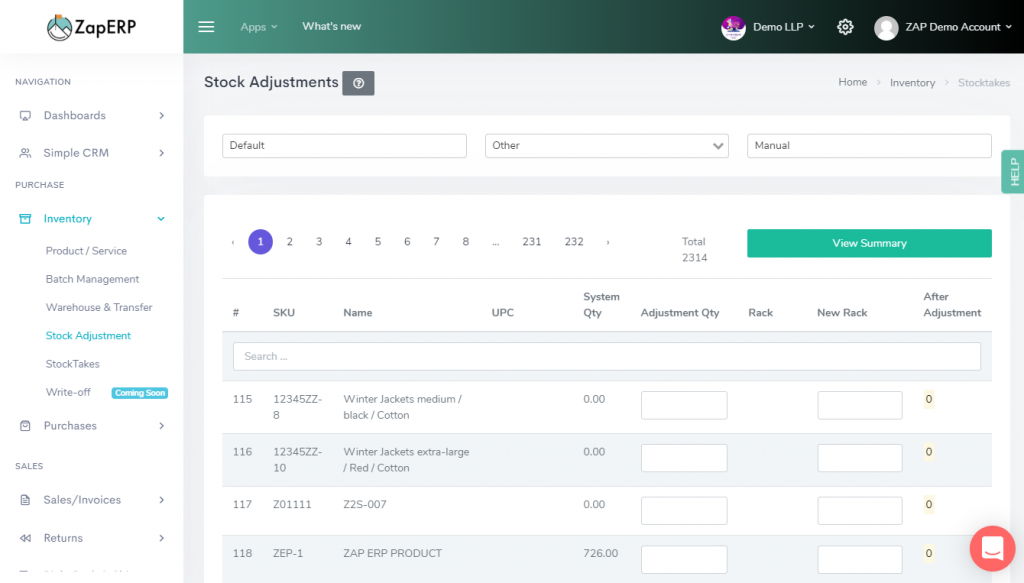
4. Stock Adjustment Feature
New Stock Adjustment screen has been added, select the Warehouse, Category of the product. Select manual Stock Adjustment or barcode Stock Adjustment.
If you want to increase the stock of the item, add the quantity you need to change. If you’re going to decrease the stock of the item, add the quantity you need to change in negative.
The updated quantity will also be synced with your sales channels like Shopify, WooCommerce, Amazon, and eBay.
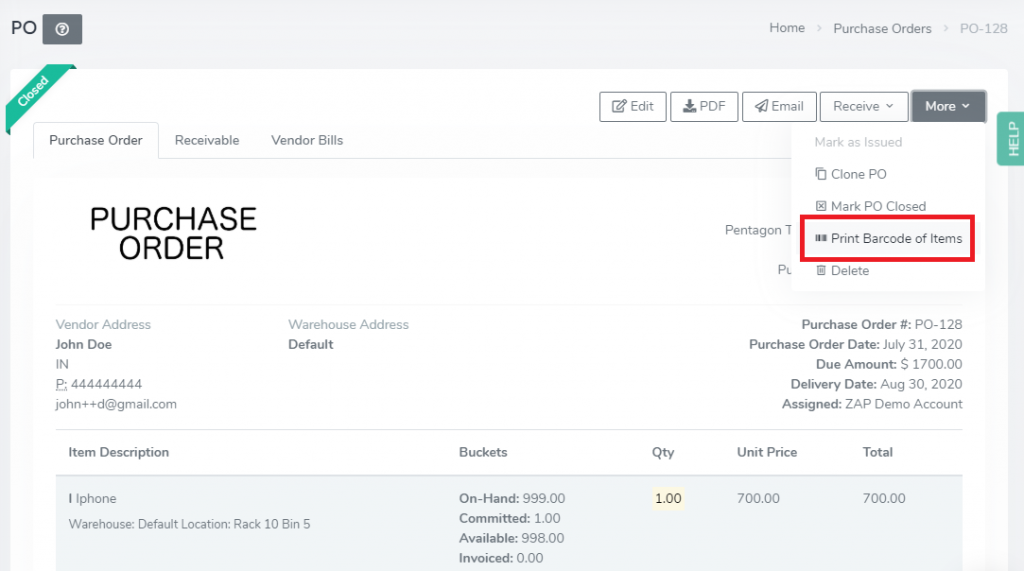
5. Purchase Order Item Barcode Generate
Print the barcodes of the products in the Purchase order directly from the Purchase order viewscreen. Open the Purchase order in the “More” button you can see the option to “Print Barcodes of the items’.
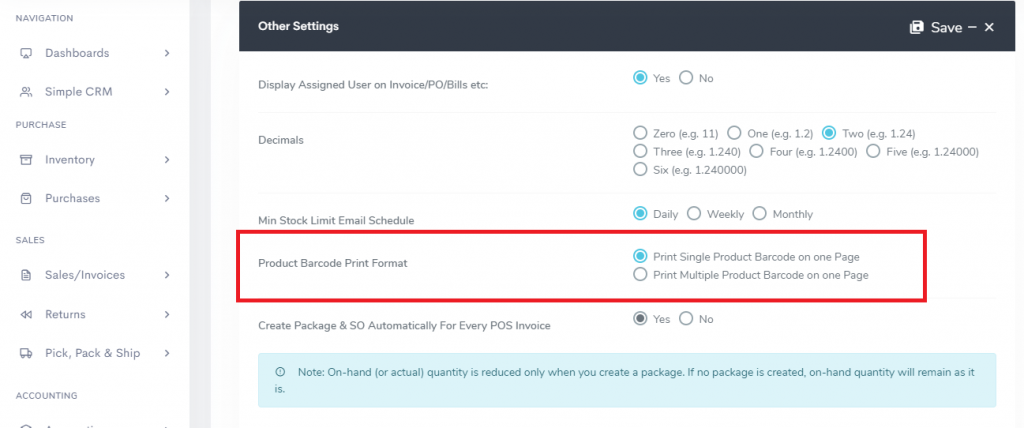
6. Multiple Barcode on one page
Select the option in the configuration to print single or multiple barcodes on one page. Check out the videos to create barcodes for
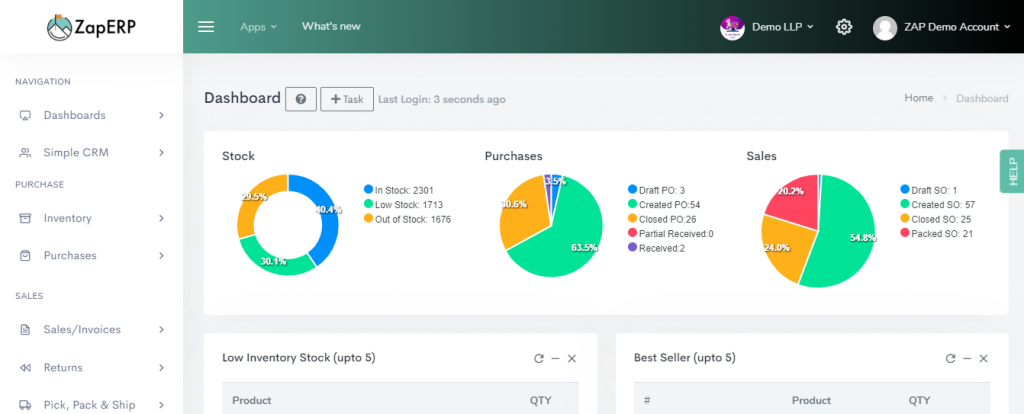
7. Updated Dashboard Graphs
ZapERP Dashboard graphs are now updated. The first graphs compare the number of In Stock, low stock, and out of stock items. The second graph compares the different stages of Purchase, and the third graph compares the different stages of Sales.

 Start using ZapInventory today
